Power and AI
The Growing Power Needs for Large Language Models
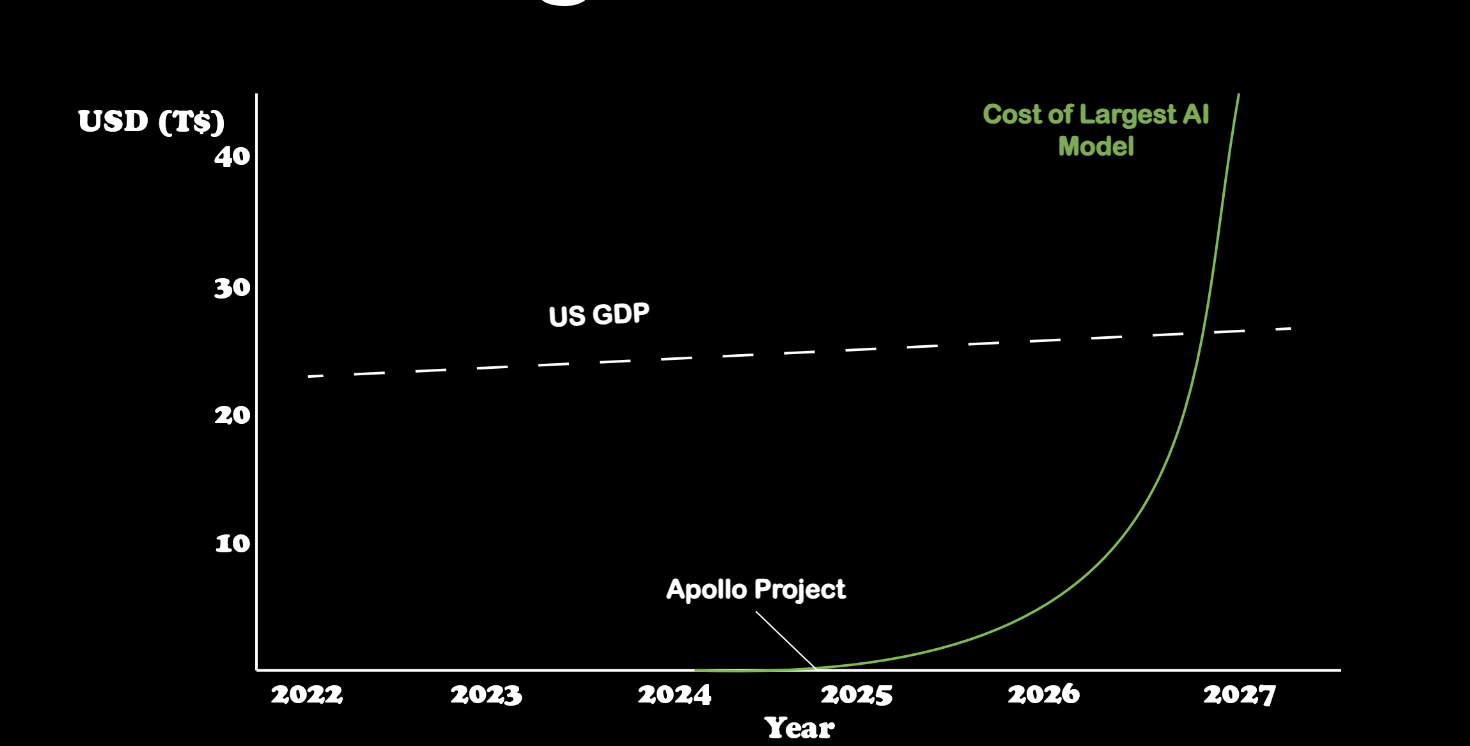
In 2024, AI is awesome, empowering and available to everyone. Unfortunately, while AI is free to consumers, these models are expensive to train and operate at scale. Training them is expected to be the most expensive thing ever. Yes, more than the Manhattan project, pyramids and the entire GDP of the world economy. No wonder companies with free compute are dominating this space.
By 2025, the cost to train an LLM surpasses the Apollo Project, a historical benchmark for significant expenditure. This projection emphasizes the increasing financial burden and resource demand associated with advancing AI capabilities, underscoring the need for more efficient and sustainable approaches in AI research and development. The data points to a future where the financial and energy requirements for AI could become unsustainable without significant technological breakthroughs or shifts in strategy.
Why?
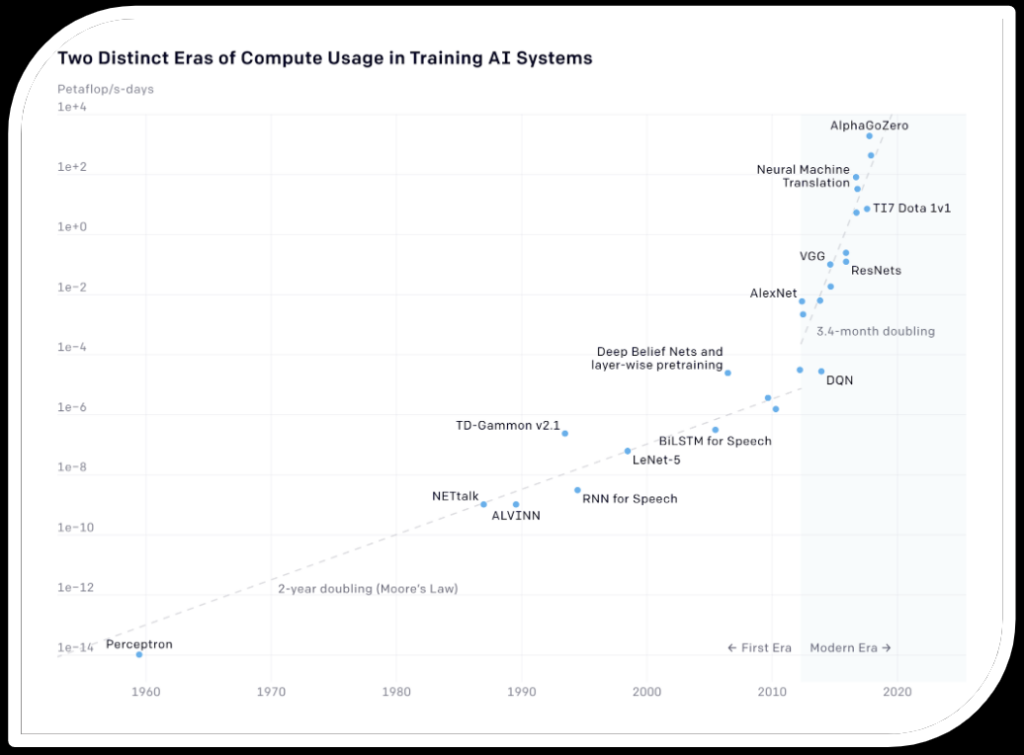
Because of how deep learning works and how it’s trained. The first era, marked by steady progress, follows a trend aligned with Moore’s Law, where computing power doubled approximately every two years. Notable milestones during this period include the development of early AI models like the Perceptron and later advancements such as NETtalk and TD-Gammon.
The second era, beginning around 2012 with the advent of deep learning, demonstrates a dramatic increase in compute usage, following a much steeper trajectory where computational power doubles approximately every 3.4 months. This surge is driven by the development of more complex models like AlexNet, ResNets, and AlphaGoZero. Key factors behind this acceleration include the availability of massive datasets, advancements in GPU and specialized hardware, and significant investments in AI research. As AI models have become more sophisticated, the demand for computational resources has skyrocketed, leading to innovations and increased emphasis on sustainable and efficient energy sources to support this growth.
Training LLMs involves massive computational resources. For instance, models like GPT-3, with 175 billion parameters, require extensive parallel processing using GPUs. Training such a model on a single Nvidia V100 GPU would take an estimated 288 years, emphasizing the need for large-scale distributed computing setups to make the process feasible in a reasonable timeframe. This leads to higher costs, both financially and in terms of energy consumption.
Recent studies have highlighted the dramatic increase in computational power needed for AI training, which is rising at an unprecedented rate. Over the past seven years, compute usage has increased by 300,000-fold, underscoring the escalating costs associated with these advancements. This increase not only affects financial expenditures but also contributes to higher carbon emissions, posing environmental concerns.
Infrastructure and Efficiency Improvements
To address these challenges, companies like Cerebras and Cirrascale are developing specialized infrastructure solutions. For example, Cerebras’ AI Model Studio offers a rental model that leverages clusters of CS-2 nodes, providing a scalable and cost-effective alternative to traditional cloud-based solutions. This approach aims to deliver predictable pricing and reduce the costs associated with training large models.
Moreover, researchers are exploring various optimization techniques to improve the efficiency of LLMs. These include model approximation, compression strategies, and innovations in hardware architecture. For instance, advancements in GPU interconnects and supercomputing technologies are critical to overcoming bottlenecks related to data transfer speeds between servers, which remain a significant challenge.
Implications for Commodities and Nuclear Power
The increasing power needs for AI training have broader implications for commodities, particularly in the energy sector. As AI models grow, the demand for electricity to power the required computational infrastructure will likely rise. This could drive up the prices of energy commodities, especially in regions where data centers are concentrated. Additionally, the need for advanced hardware, such as GPUs and specialized processors, will impact the supply chains and pricing of these components.
To address the substantial energy needs of AI, particularly in powering the growing number of data centers, various approaches are being considered. One notable strategy involves leveraging nuclear power. This approach is championed by tech leaders like OpenAI CEO Sam Altman, who views AI and affordable, green energy as intertwined essentials for a future of abundance. Nuclear startups, such as Oklo, which Altman supports, are working on advanced nuclear reactors designed to be safer, more efficient, and smaller than traditional plants. Oklo’s projects include a 15-megawatt fission reactor and a grant-supported initiative to recycle nuclear waste into new fuel.
However, integrating nuclear energy into the tech sector faces significant regulatory challenges. The Nuclear Regulatory Commission (NRC) denied Oklo’s application for its Idaho plant design due to insufficient safety information, and the Air Force rescinded a contract for a microreactor pilot program in Alaska. These hurdles highlight the tension between the rapid development pace of AI technologies and the methodical, decades-long process traditionally required for nuclear energy projects .
The demand for sustainable energy solutions is underscored by the rising energy consumption of AI servers, which could soon exceed the annual energy use of some small nations. Major tech firms like Microsoft, Google, and Amazon are investing heavily in nuclear energy to secure stable, clean power for their operations. Microsoft has agreements to buy nuclear-generated electricity for its data centers, while Google and Amazon have invested in fusion startups .

